Data, BI & Cloud Solutions

Turn Business Data Into Information Your Team Can Actually Use

AZ Technologies LLC provides data and BI consulting services for businesses that need clearer reporting, better operational visibility, and more reliable ways to work with information across their systems.

We help teams improve dashboards, reporting workflows, SQL-backed analysis, data movement, and cloud analytics without turning every reporting problem into a massive data transformation project.

The goal is straightforward: make important business information easier to trust, understand, and act on.

Useful Business Intelligence

Focus dashboards and reporting around the decisions people actually need to make instead of producing more charts for the sake of reporting.

Better Data Workflows

Reduce manual exports, repetitive spreadsheet work, inconsistent reporting, and unnecessary movement of data between systems.

Practical Cloud & Data Architecture

Design reporting and analytics solutions around the systems you already have, the data you actually need, and the level of complexity the business can support.

What we do

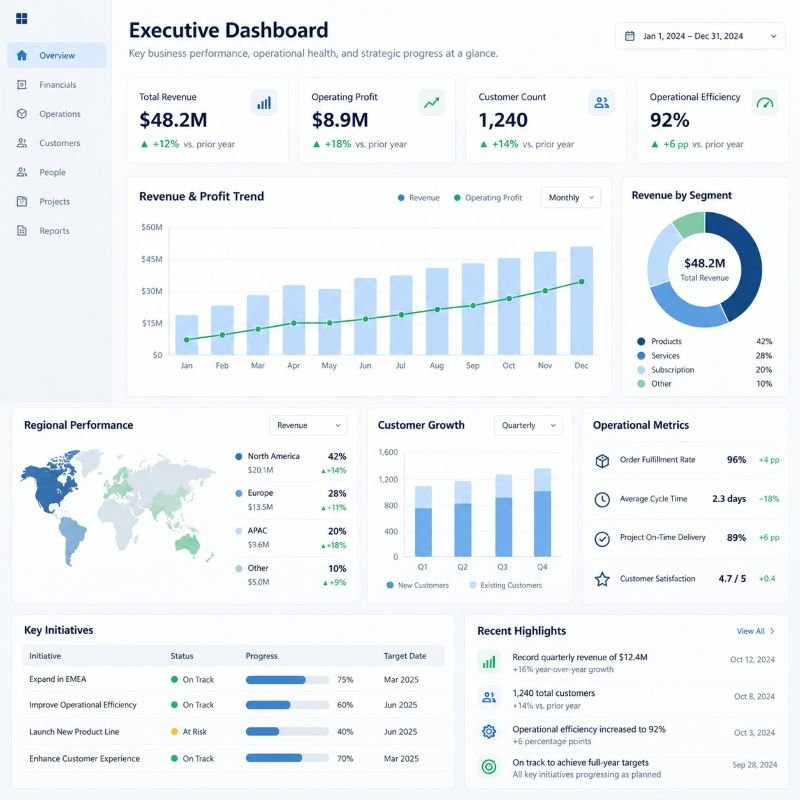
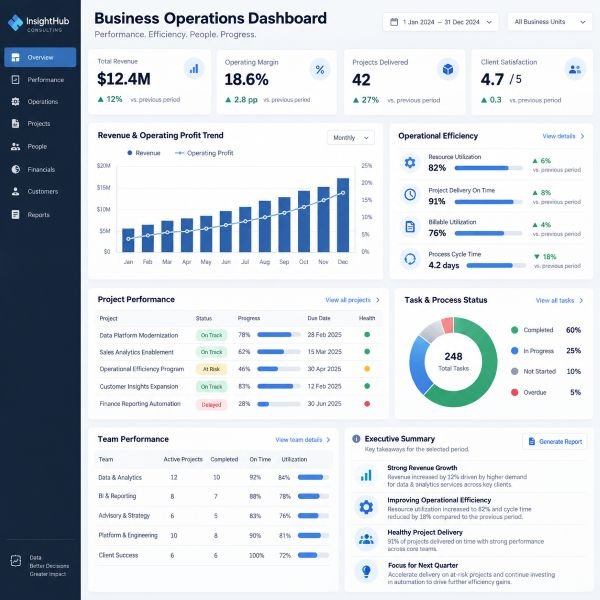
Business intelligence dashboard for KPI reporting

Business Intelligence Dashboards

Design operational, executive, project, sales, and performance dashboards around useful KPIs and business questions.
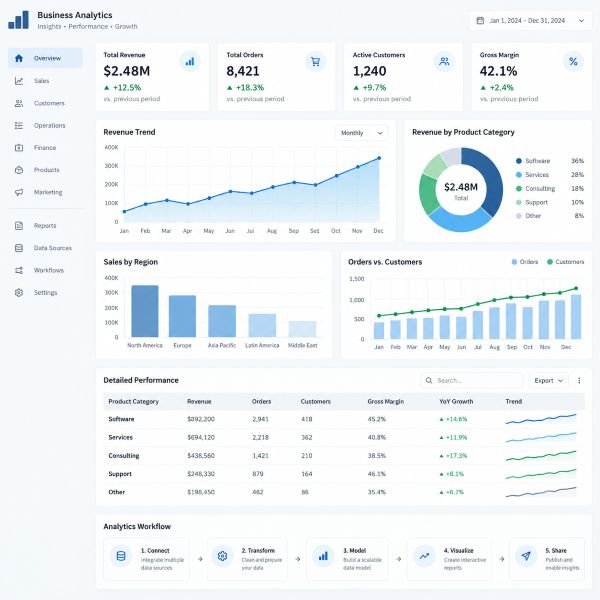
Power BI & Reporting Workflows

Plan and improve Power BI dashboards, reporting logic, data models, recurring reports, and stakeholder-facing views.
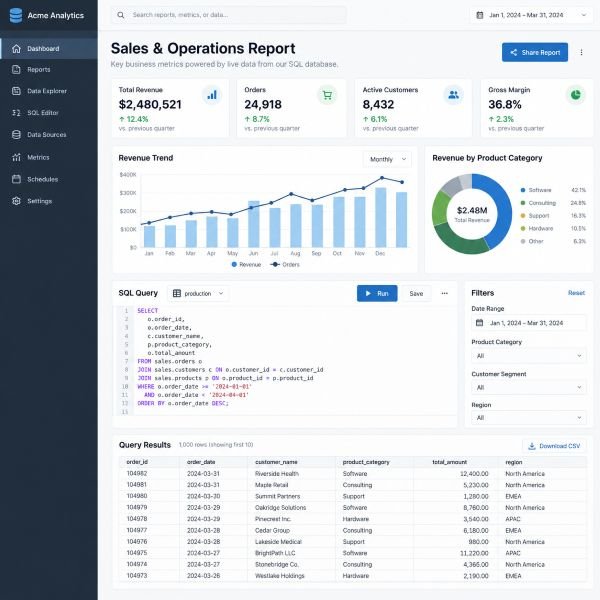
SQL data reporting and business analytics

SQL & Data Reporting

Support SQL-backed reporting, data relationships, reporting queries, field mapping, and structured business analysis.
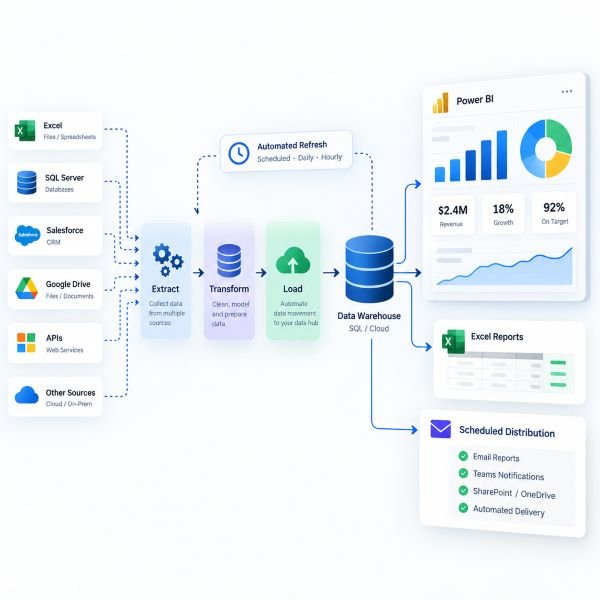
Data integration and automated reporting workflow

Data Integration & Reporting Automation

Reduce manual exports and repetitive reporting by moving information between platforms, databases, spreadsheets, and dashboards more efficiently.
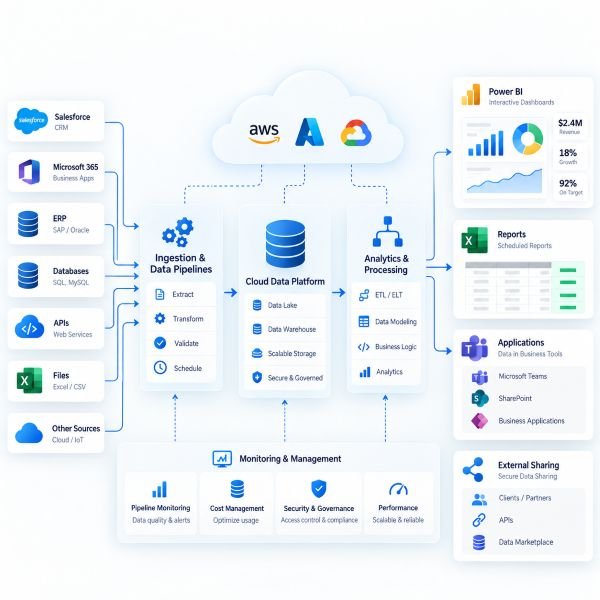
Cloud analytics and data workflow consulting

Cloud Analytics & Data Workflows

Plan data pipelines, cloud reporting workflows, SaaS data movement, and analytics systems across modern cloud environments.
Operational Reporting Strategy

Define what should be measured, where the data should come from, who needs visibility, and how reporting should support day-to-day decisions.
Too much data but not enough visibility?

Let’s turn your reporting into something your team can actually use.

When Reporting Becomes a Workflow Problem

Many reporting issues are not caused by the dashboard.

The real problem may be inconsistent data entry, disconnected platforms, manual spreadsheet exports, unclear KPI definitions, or different teams calculating the same metric in different ways.

Before adding another dashboard, we look at the workflow behind the data.

Power BI and Business Reporting

Power BI can provide useful operational visibility, but only when the reporting model starts with clear questions.

We help businesses define what should be measured, identify the right data sources, structure reporting logic, and create dashboards that support actual decisions.

Data Integration Before Dashboard Development

When information lives across multiple platforms, reporting often requires integration before visualization.

That can involve SQL, APIs, spreadsheets, SaaS exports, cloud data platforms, or automated data workflows. The right architecture depends on the volume, frequency, reliability, and importance of the data.

Related Services